


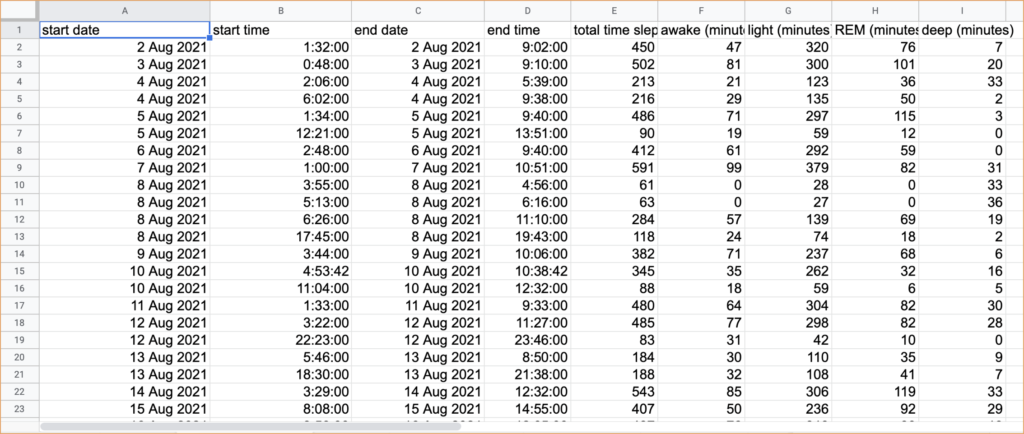
Recording sleep and step count data
2nd Aug 21 - 31st Jul 22


From phone, extracted data into an excel file


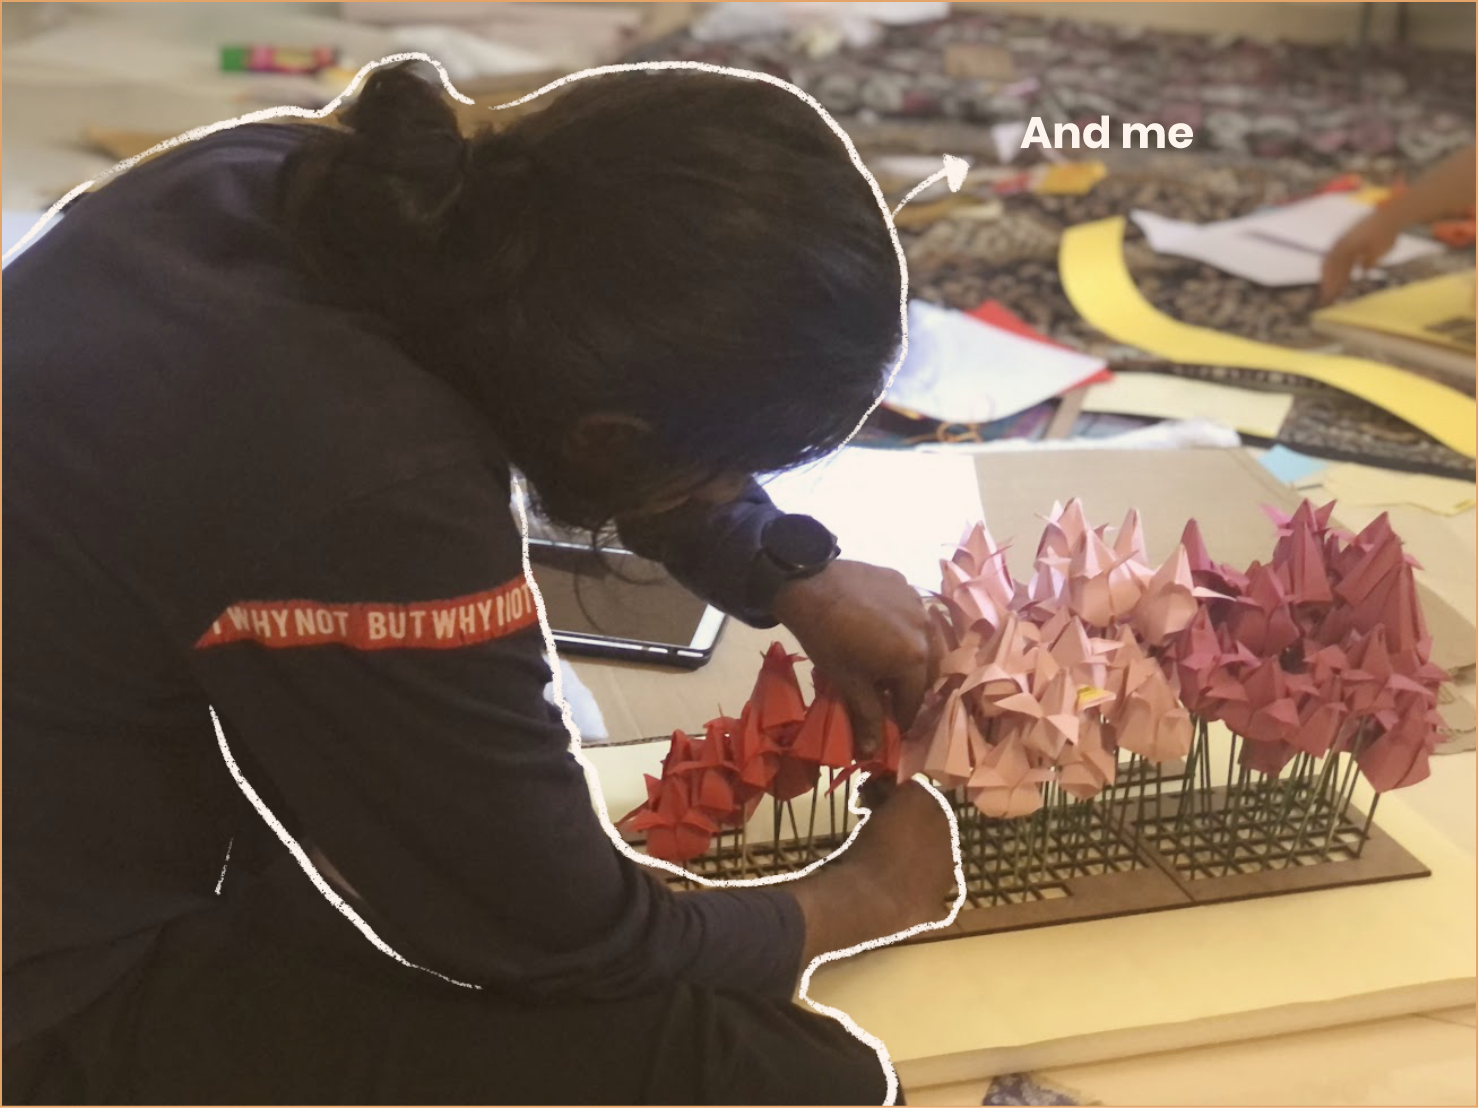
Implementing 250+ entries is very difficult, but it was doable in 2 days because of my friends Janani, Karvendan, Vijay, Dhashna, and Annya.
It was enjoyable working as a team, and there was a sync between us, which made us complete this on time.


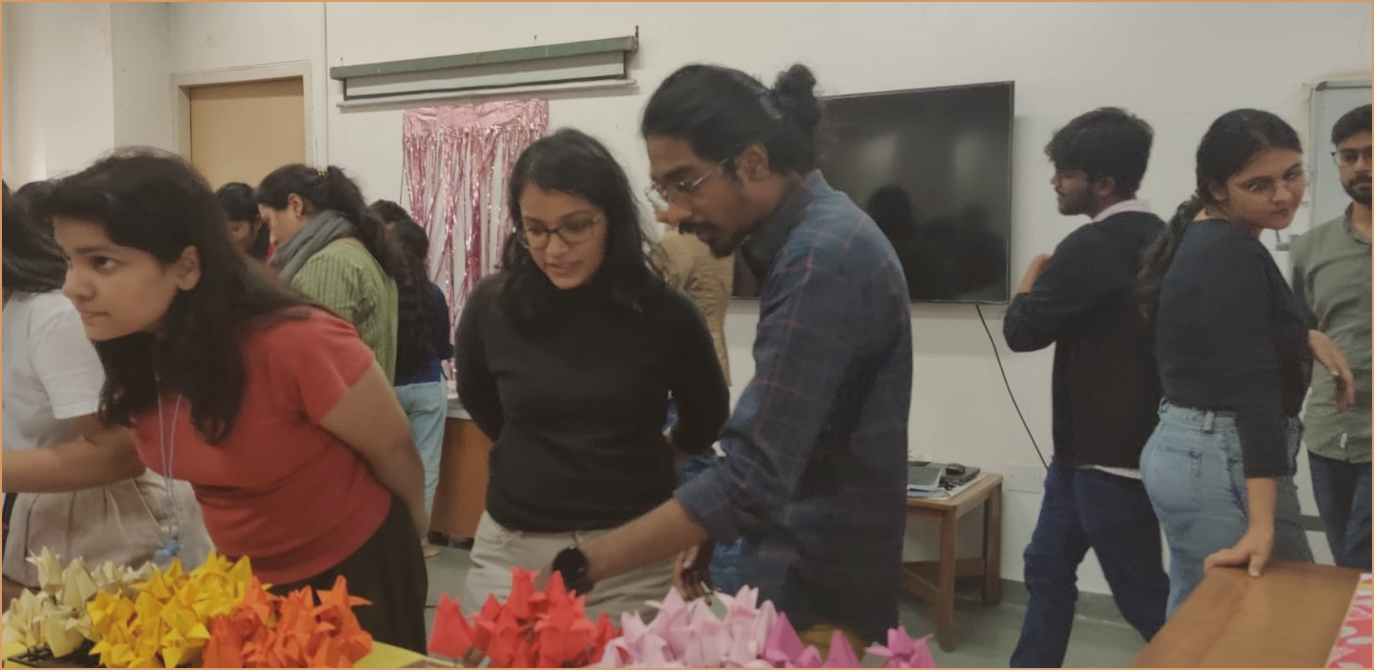
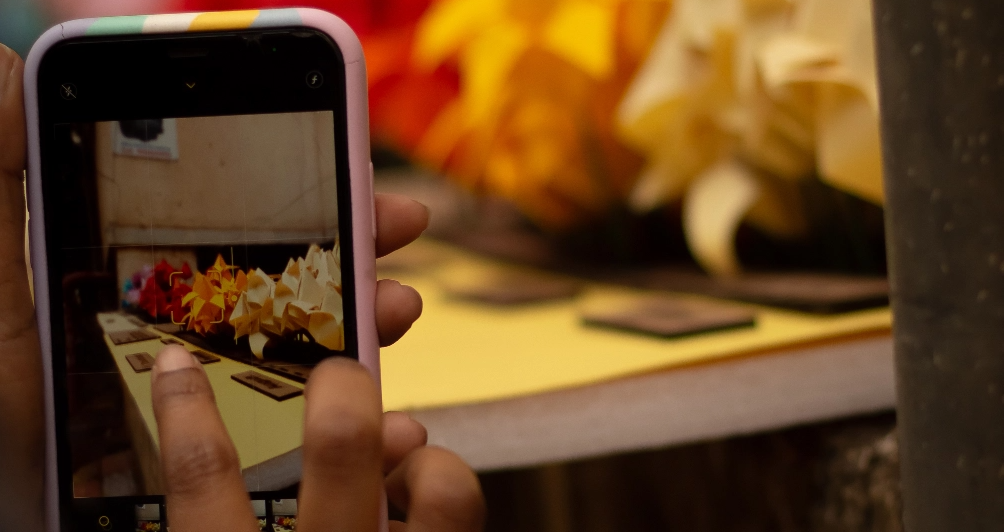
Presented in information design - tangible data viz module, people who visited it had a great time with this installation, the form, and the color is so inviting, everybody peaked into this one.
(10/09/2022)


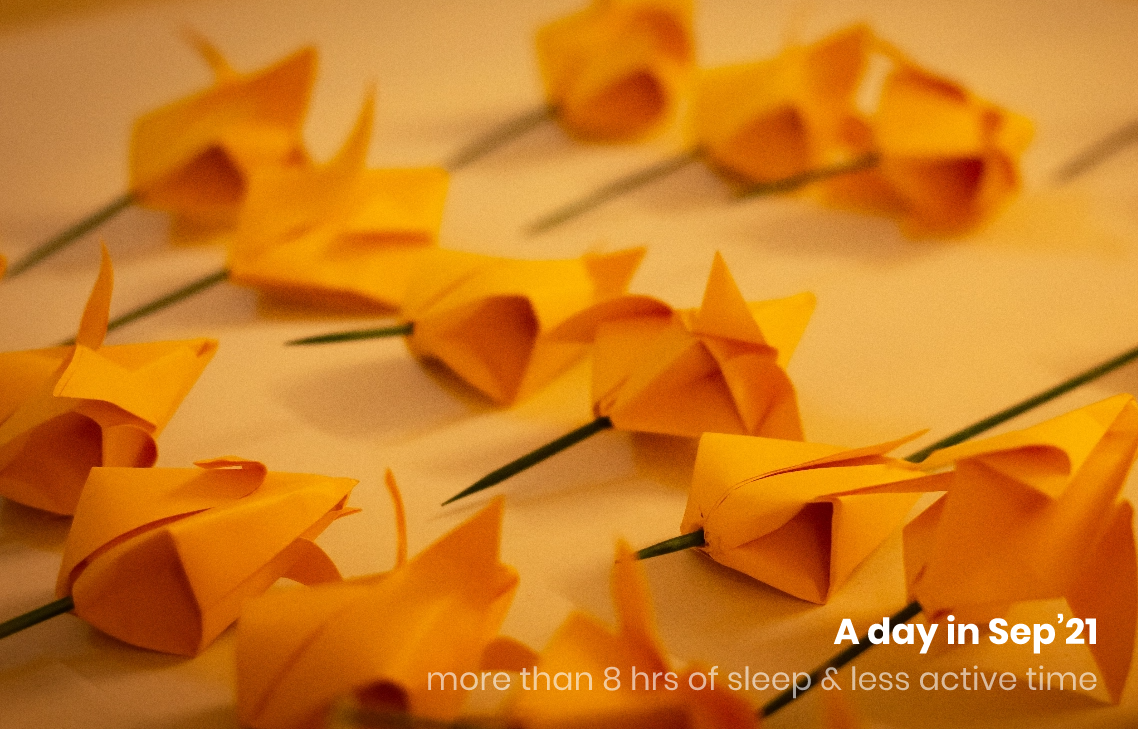


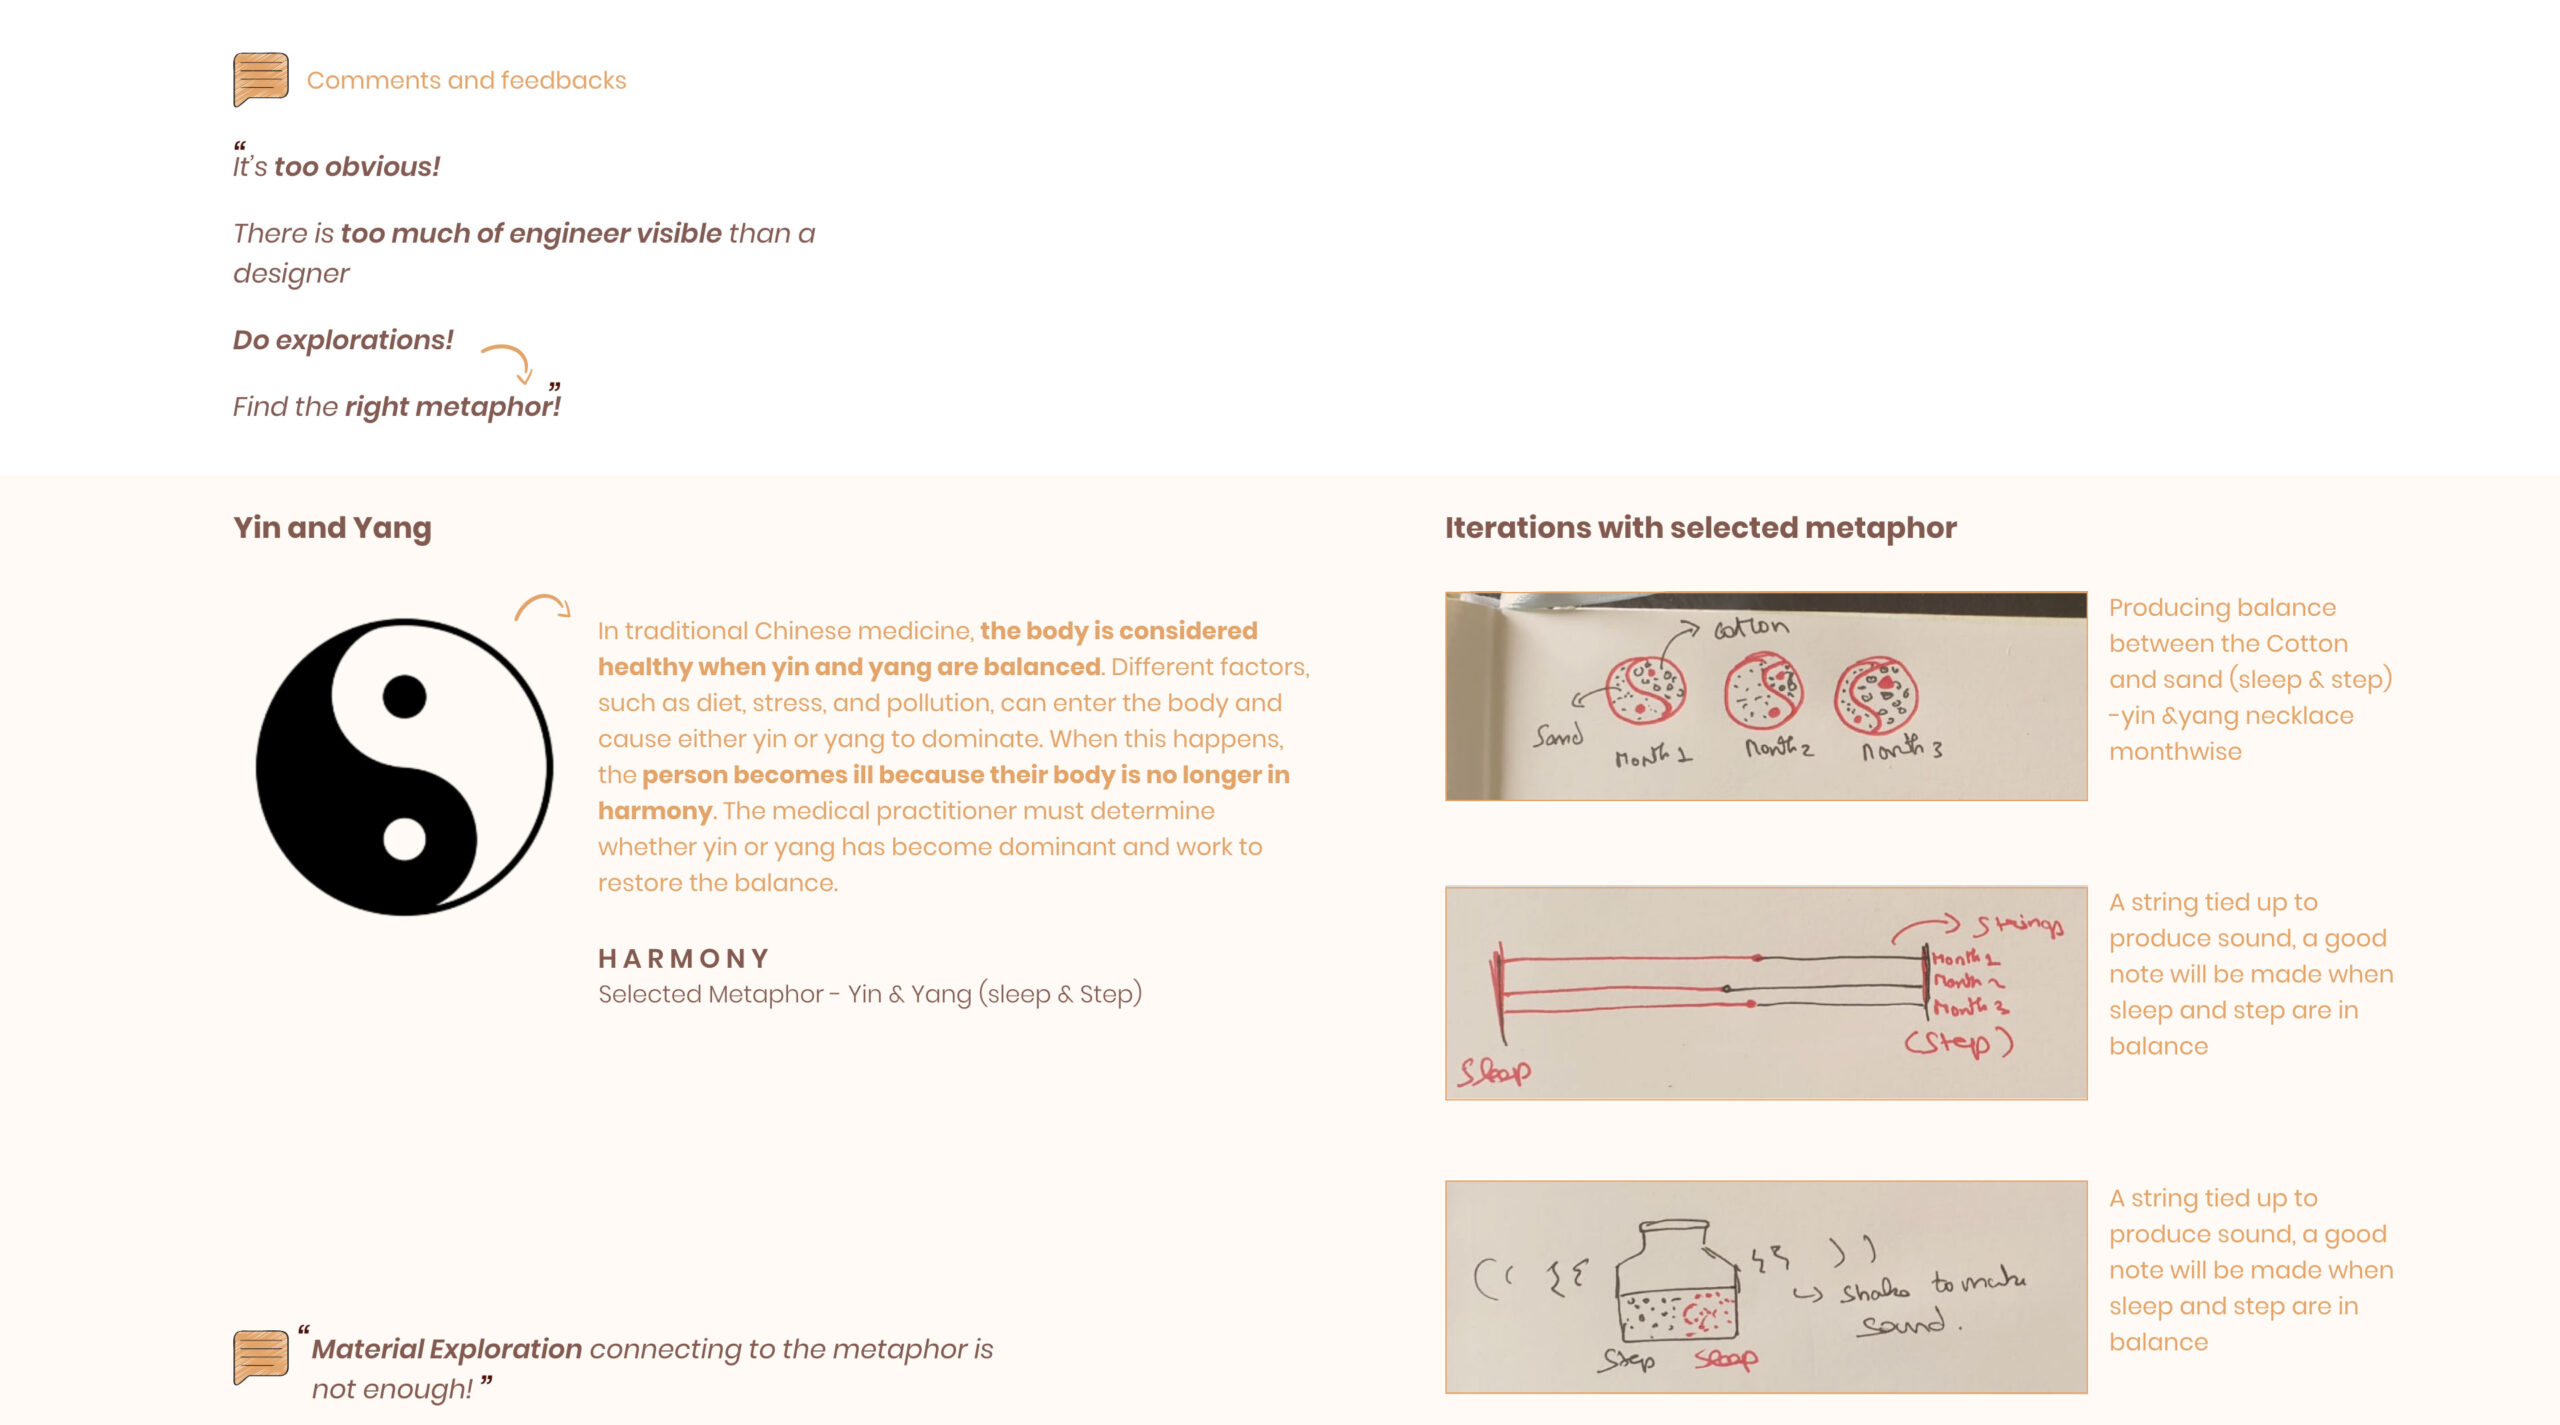
It can be used as a live screensaver or wallpaper based on everyday sleep count and step count. Instead of showing the actual numbers of sleep and step data, flower blossom works better to start a day.

The users can customize the flowers they like and add them to their widget list. This way, the users can be informed whether their sleep and step count are in harmony