The Data of
Coffee Breaks
3 mins read
This article uncovers the hidden narratives in everyday objects, illustrating how something as simple as a coffee stain can be a repository of insightful data.
Unmute the audio for better experience || Please view in full screen mode
Data Patterns in Daily Designs
In the life of a data enthusiast, patterns emerge from the most commonplace scenarios.
To the untrained eye, these patterns may appear trivial, but to a designer, they speak volumes. The narrative of data is etched in the mundane, and my recent encounter with a coffee mug while working with data is a testament to this fact.
The Art of Analytical Sips
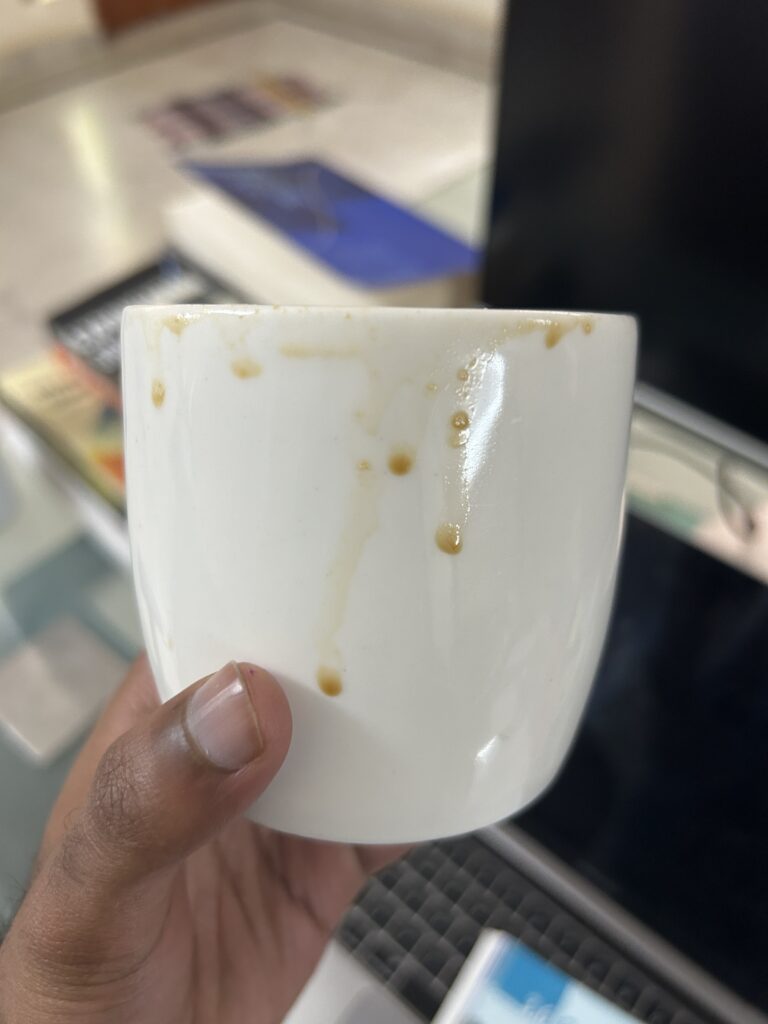
Picture this: a regular morning, the air steeped with the aroma of brewed coffee, and a desk cluttered with the tools of data trade. Amid the hum of computations and keystrokes, my gaze settles on the coffee mug. Not just any mug — this one is a canvas, painted with the residue of my sipping sequence.
“The stains are not random; they are data points, a silent storyteller of my morning.”

Stains of Time: The Coffee Mug Histogram
The length of each coffee stain, the thickness, the overlap — they all tell a story. They map out the periods of deep work, the moments of distraction, the lapses into deep thought. Each sip is a marker of time, an organic timestamp of my cognitive state. The stains are a histogram of habit, a measure of attention, a graph of the gulps that fuel my thoughts.


Few taken snaps
Brewed Data: Sipping Through the Workday
This visual isn’t merely about the coffee or the cup it came in. It’s a liquid ledger, a caffeinated chart of my workday rhythm.
“On this day, it took me 14 sips to finish a cup of coffee. Each sip is a moment, a minute, a muse.”
The longer green streaks on the mug paint a picture of intense focus, moments when my work consumed me as much as I consumed my brew. Amidst these verdant valleys, two thoughtful blue lines emerge, signifying deep dives into the ocean of thought. But not all moments are productive; the red lines are honest admissions of distraction, brief escapes from the task at hand. These colors together chart the ebb and flow of a data designer’s day, told in the tinctures left on porcelain white.

Subtle Data: The Designer’s Lens
As designers, or anyone attuned to the subtleties of our surroundings, we have the unique ability to observe and interpret. Data is not confined to spreadsheets or databases. It’s in the ebb and flow of city traffic, the rhythm of footfalls on a jogging path, and the silent dance of shadows across a sundial. It is the quantified self, writ large and small.
The Data-Enriched Life
In embracing this broader view of data, we open ourselves to a richer understanding of our environment and ourselves. We become better equipped to make informed decisions, to see the hidden threads that connect our actions to outcomes, and to appreciate the beauty of data in its most organic form.
Morning Brew: A Data Story in Every Sip
So, the next time you take a sip of your morning coffee, consider the data points you’re creating. Think about what they say about you, your habits, and your focus. There’s a story there, in the depths of your cup, waiting to be read.